Microcontroleur Hardware / Open Source - Semestre 9
Annee academique : 2024-2025 Categorie : Electronique embarquee, IoT, Hardware Open Source
PART A - Presentation Generale
Vue d'ensemble
Ce cours, qui fait suite a la semaine de travaux pratiques au laboratoire AIME pour la fabrication d’un capteur de gaz, se concentre sur l’integration de ce capteur dans un systeme complet base sur des microcontroleurs open source. L’objectif principal est de concevoir un dispositif intelligent capable de collecter, transmettre et visualiser les donnees issues du capteur de gaz, en utilisant des technologies open source et des protocoles de communication sans fil.
Le projet couvre l’ensemble de la chaine, depuis le capteur physique jusqu’a l’application mobile, en passant par la programmation du microcontroleur, la mise en place d’un reseau LoRaWAN, la creation de tableaux de bord avec Node-RED et le developpement d’une application mobile avec MIT App Inventor.
Objectifs pedagogiques :
- Comprendre et utiliser les plateformes microcontroleurs open source (Arduino UNO, ESP32, ESP8266)
- Interfacer des capteurs avec un microcontroleur via les protocoles GPIO, I2C, SPI
- Mettre en place une communication sans fil (LoRa, BLE, WiFi)
- Concevoir des flux IoT avec Node-RED pour le traitement et la visualisation de donnees
- Developper une application mobile avec MIT App Inventor
- Creer un dashboard temps reel pour la supervision de capteurs
- Concevoir un circuit imprime (PCB) avec KiCad
Outils et technologies :
| Outil / Technologie | Usage |
|---|---|
| Arduino UNO | Microcontroleur central du systeme |
| Module LoRa RN2483 | Communication sans fil longue portee |
| ChirpStack | Serveur reseau LoRaWAN |
| Node-RED | Flux de traitement et dashboard IoT |
| MIT App Inventor | Developpement application mobile Android |
| KiCad | Conception de circuits imprimes (PCB) |
| MQTT | Protocole de messagerie IoT |
| Ecran OLED SSD1306 | Affichage local des donnees (I2C) |
PART B - Experience et Contexte
Environnement de travail
Ce cours s’inscrit dans la continuite du module AIME ou nous avons fabrique un capteur de gaz a base de nanoparticules de WO3. L’enjeu etait desormais de transformer ce composant en un dispositif fonctionnel et connecte, en l’integrant dans un systeme electronique complet.
Le travail s’est deroule en plusieurs phases :
- Cablage et integration materielle : connexion du capteur, du microcontroleur Arduino UNO, du module LoRa RN2483, de l’ecran OLED et des composants auxiliaires (LED, resistances).
- Programmation embarquee : developpement du firmware Arduino en langage C pour la lecture du capteur, l’affichage sur ecran OLED et la transmission des donnees via LoRa.
- Infrastructure reseau : configuration du serveur LoRaWAN ChirpStack et du broker MQTT pour la reception des donnees.
- Visualisation et supervision : creation de flux Node-RED et d’un dashboard temps reel pour surveiller les niveaux de gaz.
- Application mobile : developpement d’une application Android avec MIT App Inventor pour le controle et la surveillance a distance via Bluetooth.
- Conception PCB : initiation a KiCad pour la conception du circuit imprime du conditionneur de signal.
Ma fonction
Dans le cadre de ce projet, j’etais responsable de :
- La comprehension des principes des technologies de microcontroleurs open source
- La conception et l’integration du systeme complet (capteur, conditionneur, microcontroleur, communication)
- Le cablage des differents composants sur breadboard
- La programmation du firmware Arduino
- La configuration des flux Node-RED et du dashboard
- Le developpement de l’application mobile MIT App Inventor
- La realisation d’essais pour tester la fonctionnalite et l’efficacite du systeme
PART C - Aspects Techniques
Concepts techniques approfondis
Cette section detaille les aspects techniques de l’integration du capteur de gaz avec un microcontroleur et le developpement d’applications pour la collecte et la visualisation de donnees.
1. Plateformes microcontroleurs open source
Le projet repose sur l’utilisation d’un Arduino UNO, une plateforme open source basee sur le microcontroleur ATmega328P. Les plateformes open source telles que l’Arduino, l’ESP32 et l’ESP8266 sont au coeur de l’IoT moderne grace a leur accessibilite, leur documentation communautaire et leur ecosysteme de bibliotheques.
Caracteristiques cles de l’Arduino UNO :
- Microcontroleur ATmega328P a 16 MHz
- 14 broches d’entrees/sorties numeriques (GPIO), dont 6 PWM
- 6 entrees analogiques (ADC 10 bits)
- Interfaces de communication : UART, I2C (SDA/SCL), SPI (MOSI/MISO/SCK/SS)
- Alimentation : USB 5V ou jack DC
Protocoles de communication utilises :
- GPIO : Lecture analogique du capteur de gaz (pin A0), controle de LED (pin D4)
- I2C : Communication avec l’ecran OLED SSD1306 (adresse 0x3C)
- UART (SoftwareSerial) : Communication avec le module LoRa RN2483 (pins 10/11)
- SPI : Utilise dans d’autres configurations avec l’ESP32 pour des capteurs additionnels
2. Capteur de gaz et interfacage
Le capteur de gaz a ete fabrique lors de la formation au laboratoire AIME. Il utilise des nanoparticules de WO3 qui permettent une haute sensibilite a des gaz specifiques comme l’ethanol et l’ammoniac. Le capteur comprend :
- Couche sensible : Nanoparticules deposees sur des peignes interdigites en aluminium
- Element chauffant : Resistance en polysilicium pour ajuster la temperature de fonctionnement
- Zone de calibration : Zone sans nanoparticules pour les mesures de reference
| Broche | Description |
|---|---|
| 2, 4 | Couche sensible (avec nanoparticules) |
| 3, 6 | Element chauffant |
| 5, 10 | Capteur de temperature |
| 7, 9 | Couche de calibration |
| 1, 8 | Non utilise |
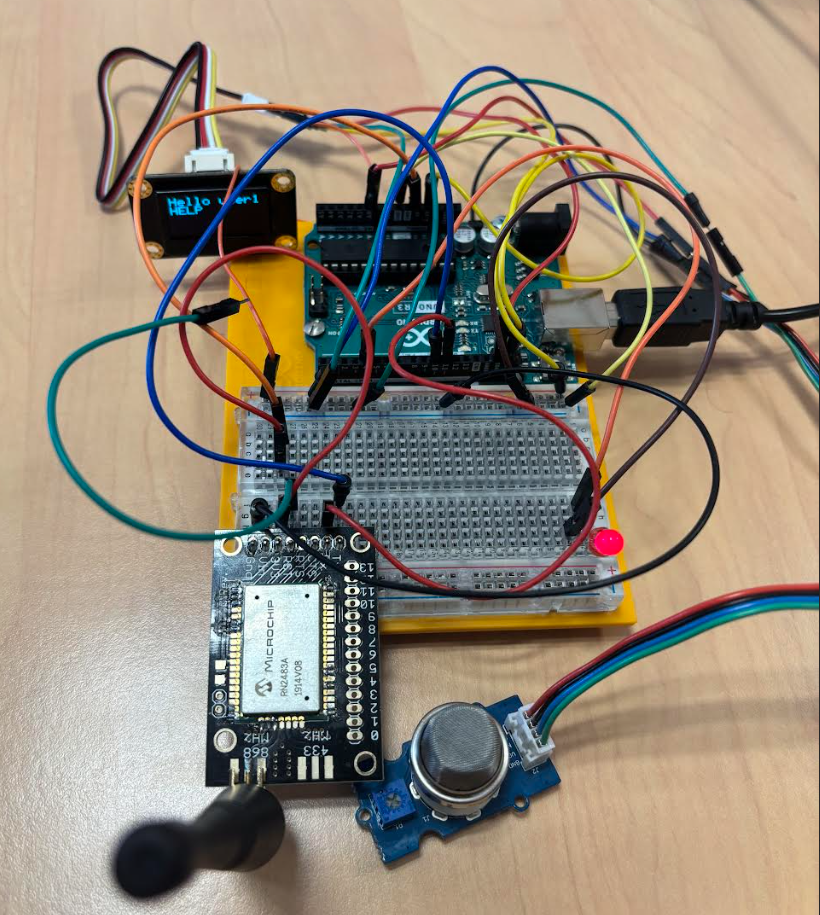
3. Cablage et integration materielle
Pour creer un systeme fonctionnel, nous avons cable les composants suivants :
- Arduino UNO : Microcontroleur central du systeme
- Module LoRa (RN2483) : Pour la communication sans fil longue portee
- Capteur de gaz : Pour detecter les concentrations de gaz
- Ecran OLED SSD1306 : Pour l’affichage local des donnees (via bus I2C)
- LED d’alerte : Indicateur visuel de depassement de seuil
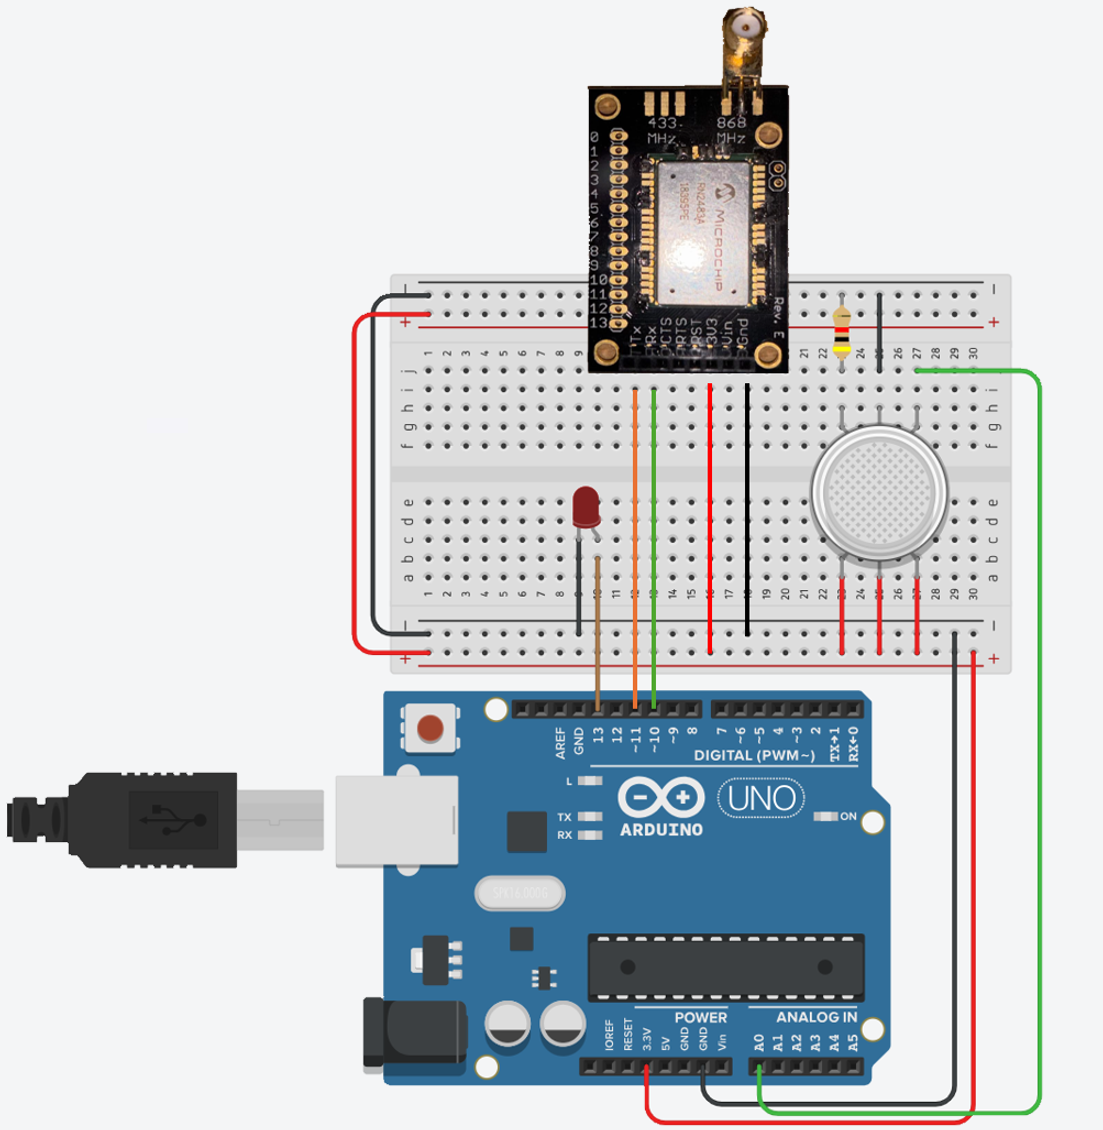
Les connexions realisees sont les suivantes :
| Composant | Broche Arduino | Protocole | Detail |
|---|---|---|---|
| Capteur de gaz | A0 | Analogique (GPIO) | Lecture ADC 10 bits |
| Module LoRa TX | Pin 10 | UART (SoftwareSerial) | Transmission serie |
| Module LoRa RX | Pin 11 | UART (SoftwareSerial) | Reception serie |
| Ecran OLED SDA | A4 | I2C | Donnees |
| Ecran OLED SCL | A5 | I2C | Horloge |
| LED d’alerte | Pin 4 | GPIO numerique | Sortie ON/OFF |
| Alimentation LoRa | 3.3V | - | Alimentation module |
| Alimentation Arduino | USB | - | 5V via USB |
4. Programmation Arduino et communication LoRa
Le code Arduino se compose de deux parties principales : l’initialisation et la transmission de donnees.
Initialisation :
- Configuration du module LoRa avec les identifiants AppEUI et AppKey pour l’enregistrement sur le reseau LoRaWAN (via ChirpStack)
- Initialisation de l’ecran OLED en I2C pour le retour visuel
- Configuration de la broche du capteur de gaz en entree analogique et de la LED en sortie numerique
Transmission de donnees :
- Lecture des valeurs du capteur de gaz via l’ADC (conversion analogique-numerique)
- Traitement : comparaison avec un seuil d’alerte (valeur > 100)
- Envoi des donnees via LoRa au serveur ChirpStack
- Mise a jour de l’affichage OLED et activation de la LED en cas de depassement
Voici le code source utilise :
#include <TheThingsNetwork.h>
#include <TheThingsMessage.h>
#include <SoftwareSerial.h>
#include "SSD1306Ascii.h"
#include "SSD1306AsciiAvrI2c.h"

const char *appEui = "9314122f9f48664f";
const char *appKey = "77F85835964FC8C511F87CE864B96A6D";

#define I2C_ADDRESS 0x3C
#define GAZ_SENSOR_PIN A0
#define LED_PIN 4
#define freqPlan TTN_FP_EU868

SSD1306AsciiAvrI2c oled;
SoftwareSerial loraSerial(10, 11); // TX, RX
TheThingsNetwork ttn(loraSerial, Serial, freqPlan);

void setup() {
    loraSerial.begin(57600);
    Serial.begin(57600);
    while (!Serial && millis() < 10000);

    Serial.println("-- STATUS");
    ttn.showStatus();

    Serial.println("-- JOIN");
    ttn.join(appEui, appKey);

    pinMode(LED_PIN, OUTPUT);

    oled.begin(&Adafruit128x64, I2C_ADDRESS);
    oled.setFont(Adafruit5x7);
    oled.clear();
    oled.set2X();
    oled.println("Hello user1");
}

void loop() {
    Serial.println("-- LOOP");

    byte GAZ_VALUE = analogRead(GAZ_SENSOR_PIN);
    Serial.print("GAZ_VALUE: ");
    Serial.println(GAZ_VALUE);

    if (GAZ_VALUE > 100) {
        digitalWrite(LED_PIN, HIGH);
        oled.clearField(0, 2, 5);
        oled.println("HELP");
    } else {
        digitalWrite(LED_PIN, LOW);
        oled.clearField(0, 2, 5);
    }

    ttn.sendBytes(&GAZ_VALUE, 1);
    delay(10000);
}
Ce code initialise le module LoRa et le capteur de gaz, lit les donnees du capteur toutes les 10 secondes, et les transmet via LoRa. Il met egalement a jour l’ecran OLED et controle une LED en fonction du niveau de gaz detecte.
Architecture de communication sans fil :
- LoRa (Long Range) : Protocole de communication sans fil bas debit et longue portee, utilisant la bande de frequence EU868 MHz. Le module RN2483 communique avec l’Arduino via une liaison serie logicielle (SoftwareSerial).
- LoRaWAN : Protocole reseau au-dessus de LoRa, gerant l’authentification (OTAA avec AppEUI/AppKey), le routage des paquets et la gestion des dispositifs via le serveur ChirpStack.
- BLE (Bluetooth Low Energy) : Utilise pour la communication entre l’Arduino et l’application mobile MIT App Inventor, permettant le controle local et la lecture des donnees en temps reel.
5. Node-RED : flux IoT et dashboard temps reel
Node-RED est un outil de programmation visuelle base sur des flux (flow-based programming), particulierement adapte au prototypage rapide d’applications IoT. Dans ce projet, Node-RED a ete utilise pour recevoir, traiter et afficher les donnees du capteur LoRa.
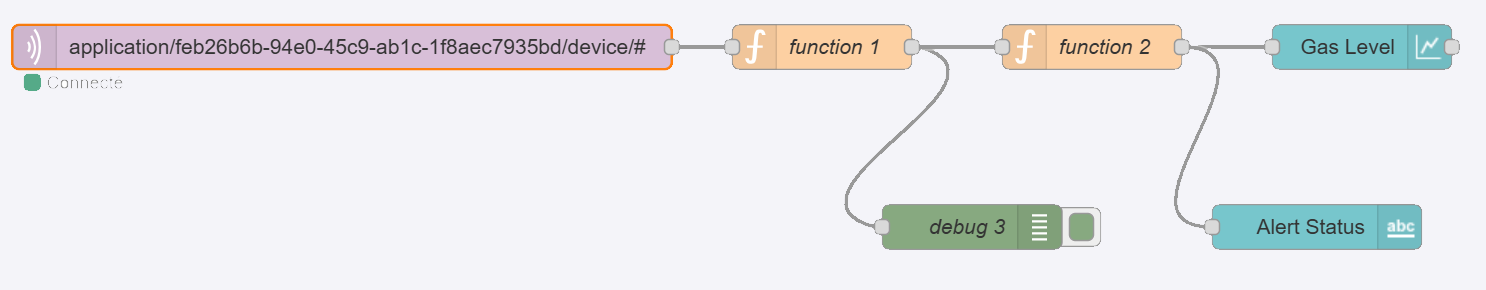
Architecture du flux Node-RED :
Le flux se decompose en quatre etapes :
- Reception des donnees : Un noeud MQTT ecoute les messages entrants du reseau LoRaWAN ChirpStack. Le broker MQTT est configure pour recevoir les trames du serveur reseau.
- Extraction des donnees : Un noeud fonction decode les donnees encodees en Base64 et extrait la valeur du niveau de gaz.
- Traitement et alerte : Un second noeud fonction analyse le niveau de gaz et declenche une alerte si la valeur depasse le seuil defini (par exemple 200).
- Visualisation : Un noeud graphique affiche les niveaux de gaz en temps reel dans le dashboard Node-RED.
Details techniques du flux :
- Noeud MQTT : Configure pour se connecter au broker de ChirpStack et s’abonner au topic du dispositif LoRa
- Noeuds Fonction : Code JavaScript pour le decodage Base64, l’extraction des donnees et l’analyse des seuils
- Noeud Chart : Affichage graphique en temps reel avec historique des mesures
- Dashboard : Accessible via
http://127.0.0.1:1880/ui, interface web responsive pour la supervision
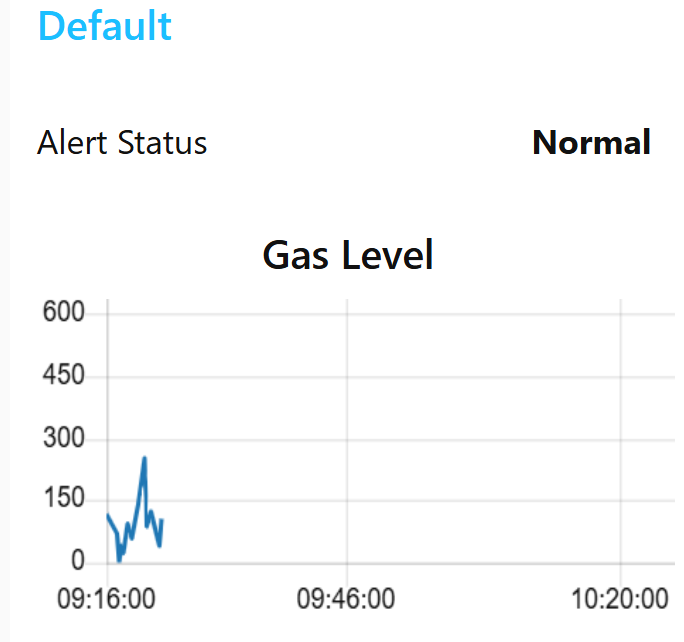
Le dashboard Node-RED permet une visualisation en temps reel des niveaux de gaz detectes par le capteur. Les donnees sont affichees sous forme de graphique temporel, permettant de suivre l’evolution des concentrations de gaz et d’identifier rapidement les depassements de seuils.
6. MIT App Inventor : application mobile Android
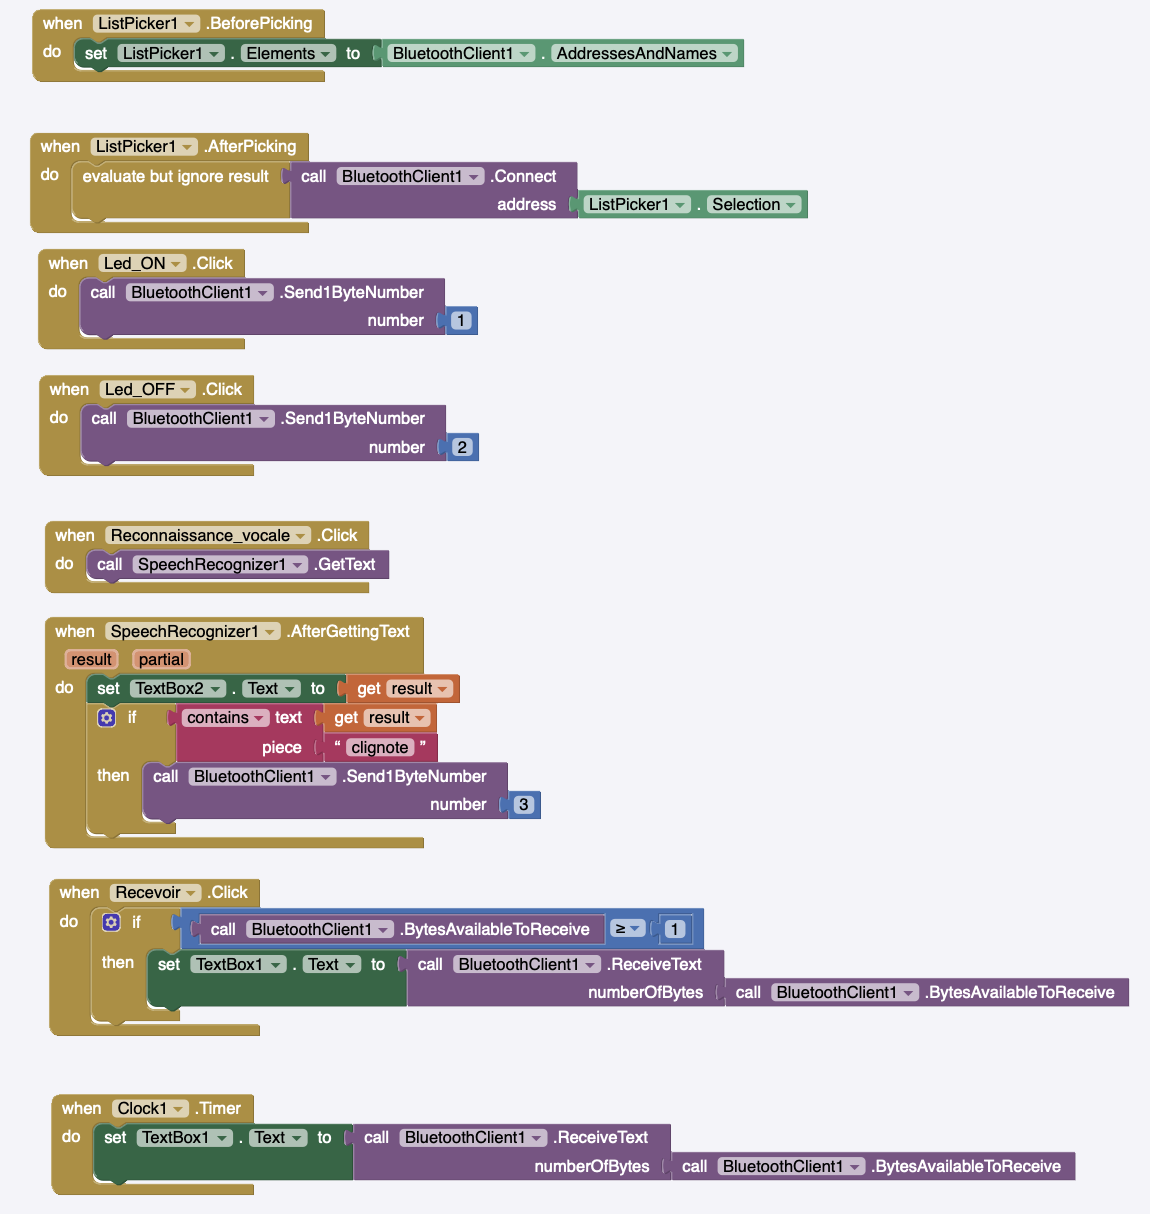
MIT App Inventor est un environnement de developpement visuel qui permet de creer des applications Android sans ecrire de code traditionnel, en utilisant une approche par blocs logiques. Dans ce projet, nous avons developpe une application mobile pour interagir avec le systeme Arduino via Bluetooth (BLE).
Fonctionnalites de l’application :
- Connexion Bluetooth : L’application se connecte a l’Arduino via Bluetooth lorsque l’utilisateur appuie sur le bouton de connexion. Cela etablit un canal de communication bidirectionnel.
- Controle de LED : L’utilisateur peut allumer ou eteindre la LED d’alerte a distance en utilisant les boutons de l’interface.
- Surveillance du niveau de gaz : L’application recoit en continu les valeurs du capteur de gaz depuis l’Arduino et les affiche en temps reel.
- Alertes : Un systeme de notification previent l’utilisateur lorsque le niveau de gaz depasse un seuil predefini.
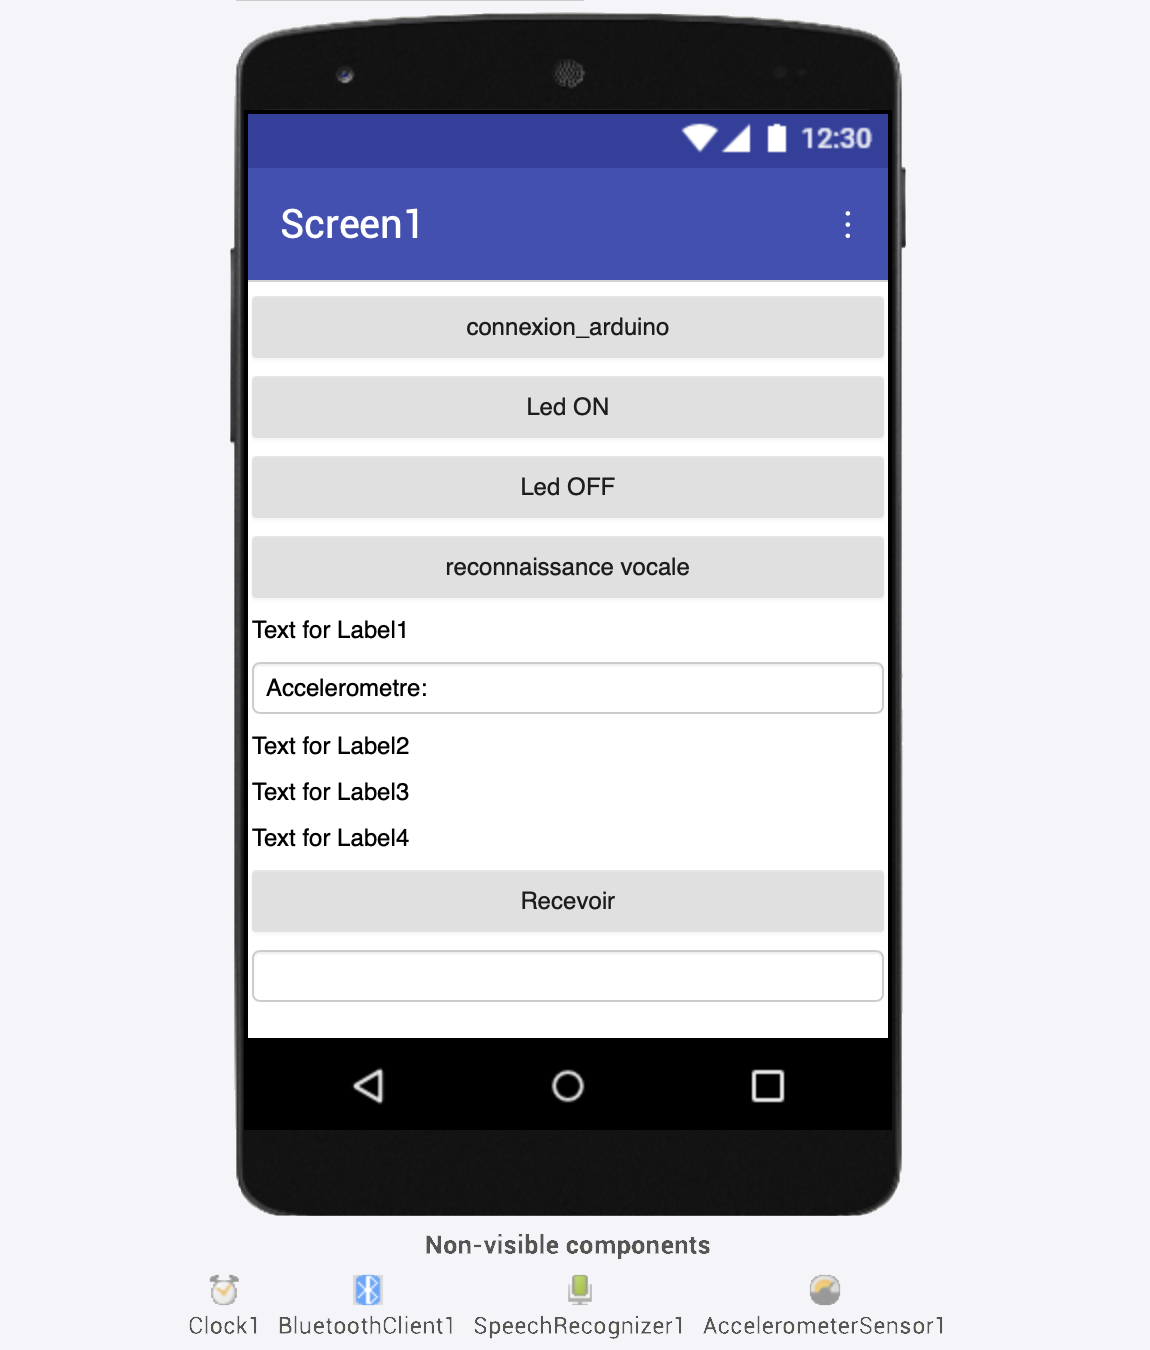
Composants cles de l’application :
- Bouton de connexion : Etablit la communication avec l’Arduino via le module Bluetooth
- Boutons de controle LED : Envoient des commandes ON/OFF a l’Arduino
- Label dynamique : Affiche le niveau de gaz actuel recu du capteur
- Notifier : Alerte l’utilisateur si le niveau de gaz depasse le seuil critique
L’application fournit une interface simple et intuitive pour interagir avec le systeme Arduino en temps reel, permettant a la fois le controle et la surveillance des conditions environnementales a distance.
7. Conception de circuit imprime avec KiCad
KiCad est un logiciel open source de conception de circuits imprimes (PCB). Dans le cadre de ce cours, nous avons ete inities a KiCad pour concevoir le circuit du conditionneur de signal du capteur de gaz. Cette etape permet de passer du prototype sur breadboard a un circuit imprime professionnel.
Etapes de conception :
- Creation du schema electrique avec les symboles des composants
- Definition des empreintes physiques des composants
- Routage du PCB en respectant les regles de conception (largeur de pistes, espacement)
- Generation des fichiers Gerber pour la fabrication
PART D - Analyse et Reflexion
Competences et connaissances mobilisees
Ce projet a mobilise un large ensemble de competences transversales :
- Comprendre l’architecture des microcontroleurs et savoir les utiliser dans un contexte IoT
- Concevoir un systeme d’acquisition de donnees complet (capteur, conditionneur, microcontroleur) adapte a l’application
- Interfacer des capteurs avec un microcontroleur via les protocoles GPIO, I2C, SPI et UART
- Concevoir le circuit electronique du conditionneur de signal du capteur (conception et simulation)
- Developper le logiciel embarque pour l’utilisation du capteur de gaz et son IHM (ecran OLED)
- Mettre en oeuvre une communication sans fil (LoRa, BLE, WiFi) pour la transmission de donnees
- Creer des flux Node-RED pour le traitement et la visualisation temps reel des donnees
- Developper une application mobile avec MIT App Inventor
- Combiner l’ensemble de ces composants en un dispositif intelligent et connecte
- Comprendre les notions fondamentales des capteurs et de l’acquisition de donnees
- Concevoir la fiche technique (datasheet) du capteur fabrique
- Concevoir un PCB avec KiCad
Auto-evaluation
Ce cours a ete une reutilisation de nombreuses competences acquises au cours de l’annee et tout au long de mes etudes d’ingenieur, notamment avec Node-RED, MQTT, le langage C et le cablage electronique. Comme je me souvenais de presque tout, je n’ai pas eu de difficulte majeure a developper le projet.
Une mention speciale pour MIT App Inventor, KiCad et ChirpStack, qui etaient des decouvertes pour moi, ajoutant de nouvelles connaissances a mon ensemble de competences. Le developpement d’une application mobile avec MIT App Inventor, bien que different de la programmation traditionnelle, m’a permis de comprendre les principes du developpement mobile et de l’interaction Bluetooth.
Je peux affirmer avec confiance que ce projet a ete mene a bien, et chaque etape que je visais a ete atteinte avec succes.
Mon avis
J’ai reellement apprecie ce cours car il impliquait de travailler sur un projet complet, depuis le composant capteur jusqu’a la creation du circuit imprime. C’est exactement le type de travail que j’apprecie : gerer un projet complet de bout en bout.
De plus, toucher a tous les aspects hardware et software etait interessant car cela m’a permis de comprendre l’ensemble du systeme et de rester informe de chaque aspect du projet. Travailler en equipe a ete benefique car nous avions une bonne communication, ce qui a facilite l’avancement du projet.
Ce qui m’a particulierement marque, c’est la coherence entre la fabrication du capteur au laboratoire AIME et son integration dans un systeme complet. Cette approche pedagogique, qui couvre l’ensemble de la chaine de valeur d’un objet connecte, est extremement formatrice et representative des defis rencontres dans le monde professionnel de l’IoT.
Lien du projet
Le projet complet est disponible sur GitHub - Capteur Gaz.